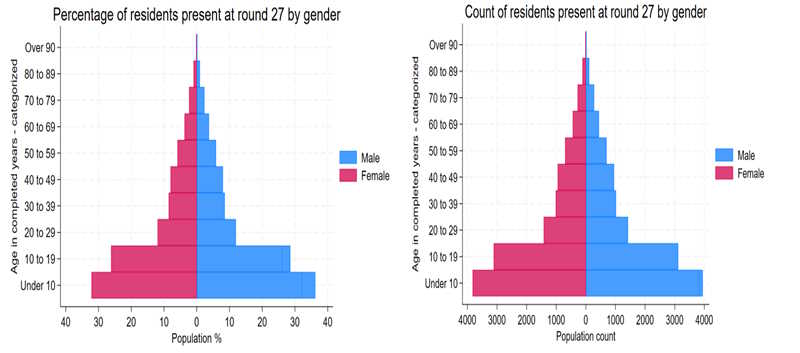
|
Start and end date
|
Jan 2022-Feb 2024
|
|
|
|
Eligibility criteria
|
GPC Residents
|
|
|
|
#Eligible for medical survey*
|
|
|
|
|
#Households (participation % - % of all HHs with eligible participants that attended medical survey)
|
921 (88.3%)
|
|
|
|
#participants (participation % - % of all eligible participants)
|
7,414
|
4,604 (62.1%)
|
2,810 (37.9%)
|
|
|
|
|
|
|
Age range (in years)
|
15-11
|
16-97
|
18-111
|
|
HIV prevalence (95% CI) n=5,489
|
627 (11.4%)
|
436 (12.3%)
|
191 (9.8%)
|
|
HPV vaccination (n=812)
|
|
430 (53.0%)
|
|
|
Sexual activity (n=812)
|
|
448 (55.2%)
|
|
|
COVID-19 vaccination
|
5,744
|
3,686 (64.2)
|
2,058 (35.8%)
|
|
How old were you when you first had sex? (Median (IQR))
|
|
17 (16;18)
|
|
|
Current use of tobacco
|
639 (8.6%)
|
186 (4.0%)
|
453 (16.1%)
|
|
Daily use of tobacco (n=638)
|
491 (77.0%)
|
115 (62.2%)
|
376 (83.0%)
|
|
Alcohol consumption in the past 12 months
|
2,106 (79.3%)
|
959 (73.8%)
|
1,147 (84.5%)
|
|
|
|
|
|
|
Medical history- Have you been diagnosed or had any of the following conditions? (n=7,406)
|
|
|
|
|
Hypertension
|
601 (8.1%)
|
429 (9.3%)
|
172 (6.1%)
|
|
Stroke/ heart disease / Angina
|
32 (0.4%)
|
18 (0.4%)
|
14 (0.5%)
|
|
Kidney failure
|
20 (0.3%)
|
7 (0.1%)
|
13 (0.5%)
|
|
ART use
|
518 (7.0%)
|
361 (7.8%)
|
157 (5.6%)
|
|
Tuberculosis
|
104 (1.4%)
|
54 (1.2%)
|
50 (1.8%)
|
|
Malaria
|
3,685 (49.8%)
|
2,357 (51.3%)
|
1,328 (47.3%)
|
|
Low/ high cholesterol
|
39 (0.5%)
|
29 (0.6%)
|
10 (0.4%)
|
|
Hepatitis B
|
29 (0.4%)
|
15 (0.3%)
|
14 (0.5%)
|
|
Leg ulcer
|
180 (2.4%)
|
104 (2.3%)
|
76 (2.7%)
|
|
Have you been operated on or had surgery before?
|
926 (12.5%)
|
751 (16.3%)
|
175 (6.2%)
|
|
|
|
|
|
|
Physical activity
|
|
|
|
|
Does your work involve activity that causes large increases in breathing or heart rate like carrying or lifting heavy loads, very brisk walking, digging or construction work for at least 10 minutes continuously?
|
4,028 (54.35)
|
2,260 (49.1%)
|
1,768 (62.9%)
|
|
Do you ever walk or use a bicycle for at least 10 minutes continuously to get to and from places?
|
4,561 (61.5%)
|
2,736 (59.4%)
|
1,825 (64.9%)
|
|
|
|
|
|
|
Diet
|
|
|
|
|
In a typical week, on how many days do you eat fruit, such as pineapple, mango, jackfruit, and passion fruit?
(Median (IQR))
|
3 (2; 5)
|
3 (2; 5)
|
3 (2; 5)
|
|
In a typical week, on how many days do you eat vegetables such as tomato, cabbage, greens, carrots, and eggplant?
(Median (IQR))
|
3 (2; 7)
|
4 (2; 7)
|
3 (2; 7)
|
|
In a typical week, on how many days do you eat starchy staples, such as posho, cassava, sweet potato and rice?
(Median (IQR))
|
7 (5; 7)
|
7 (5; 7)
|
7 (5; 7)
|
|
In a typical week, how often did you drink sugary drinks (e.g. soda, fruit juices, squashes, Obushera, Minute Maid) or sweetened tea or coffee?
(Median (IQR))
|
7 (4; 7)
|
7 (4; 7)
|
7 (3; 7)
|
